Why agencies and brands use LemonBridge
monitoring their data activation flows
Know how every flow is performing.
See every flow end to end, with real-time data and alerting on volume, failures, and freshness.
See what is working and what needs attention
Monitor volume, failure rate, and data freshness for every flow in one dashboard. No tab switching. No guesswork.
Know why it broke, not just that it broke
When a flow fails, the Diagnostics Agent analyzes the full context and explains the cause in plain language, so anyone on your team can understand what happened.
Answer what happened with evidence
The audit trail records every change and incident, showing who did what, when it happened, and how many records were affected. When a client asks, you have a clear answer backed by data.

Everything you need to stay ahead of incidents
See how every flow is performing, get notified when something changes, understand the cause, and keep the evidence.
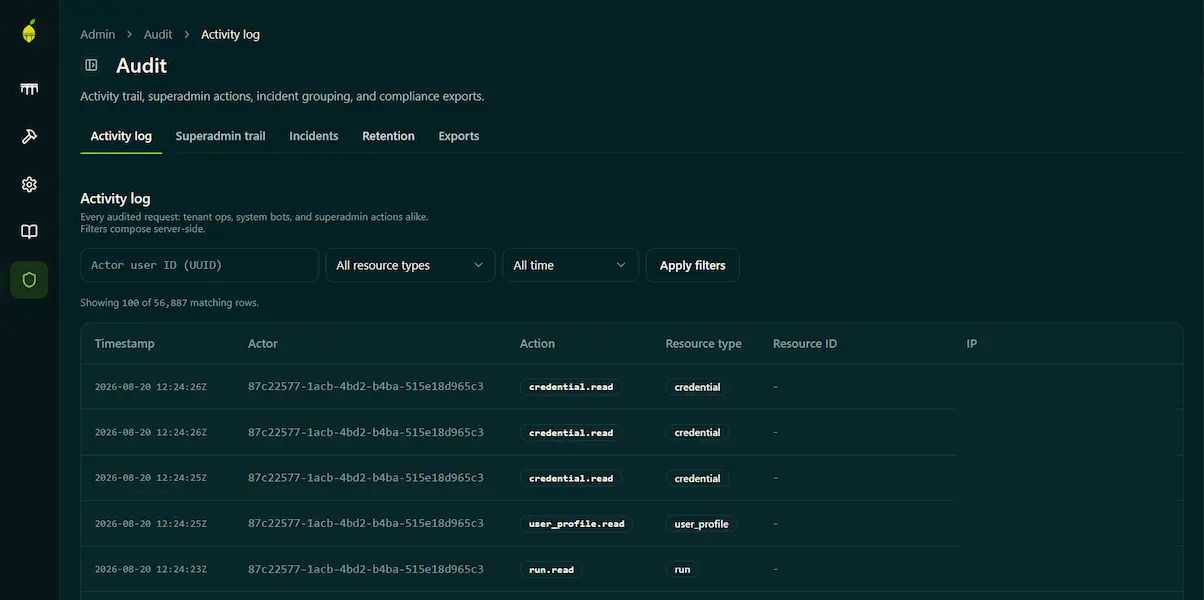
Ask what went wrong. Get a clear answer.
The Diagnostics Agent analyzes the full context of the source, bridge, and destination to explain the likely cause in plain language. Use it in LemonBridge or through Slack.
- Get an answer built on context. It combines error categories, record counts, and schema information instead of showing you a raw stack trace.
- Let anyone pick up an incident. Clear explanations help a junior teammate move the issue forward while a senior consultant stays focused on client work.
- Get to the likely cause faster. Replace an afternoon of tracing logs with a focused explanation of what happened and where to look.
A successful request does not always mean successful processing. A 200 response only confirms that the destination accepted the request. The Diagnostics Agent also looks at the counts and patterns that reveal whether IDs were recognized, profiles were matched, and data was processed as expected.
It sees context, not customer data. The agent uses metadata such as error categories, counts, schema names, and sanitized configuration. It does not access row-level data or secrets.
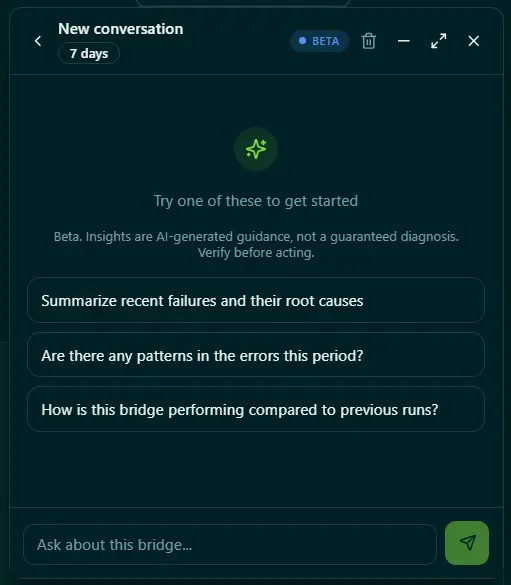
Know how every flow is performing
See every step from source through transformation to destination in real time, with volume, failure rate, and data freshness in one dashboard.
- Bring evidence to every SLA conversation. Use actual performance data to show what happened, when it happened, and how the flow performed.
- Go beyond “the job ran.” LemonBridge uses the platform’s actual API responses to show whether each flow is behaving as expected.
- Spot problems before your client does. See what is working and what needs attention without waiting for someone else to report it.
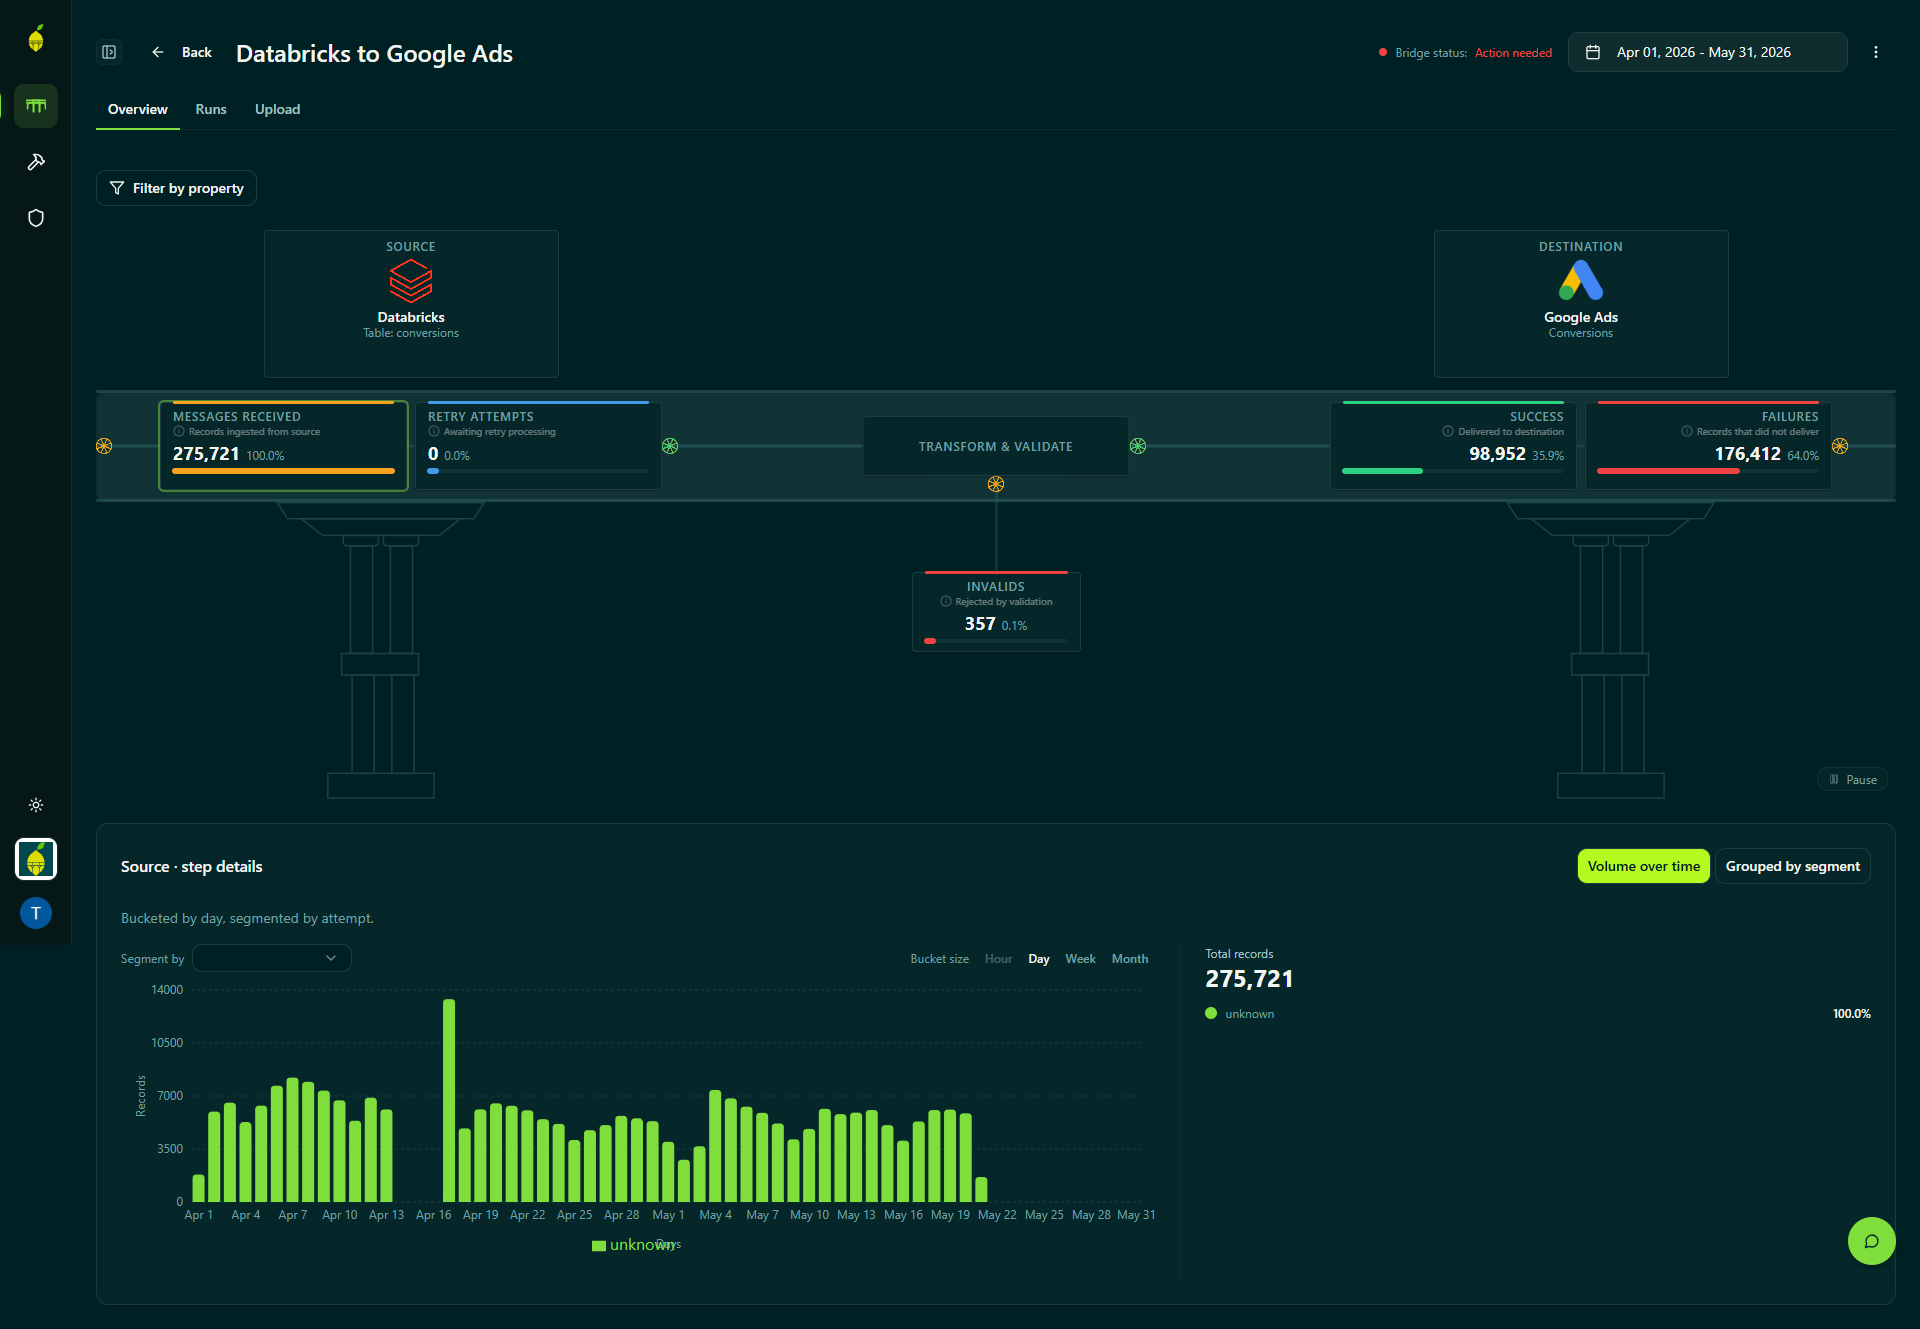
Know when a bridge needs attention
See the live health of every bridge and get notified through Slack, Teams, email, or a webhook as soon as behavior deviates from normal.
- Detect issues earlier and recover sooner. Shorten the time between the first warning signs and your response, reducing downtime for every incident.
- Catch more than complete outages. Alerts cover volume drops and staleness thresholds, not just whether a bridge is running.
- Stay informed where you already work. Receive notifications in your preferred channel without keeping the dashboard open.
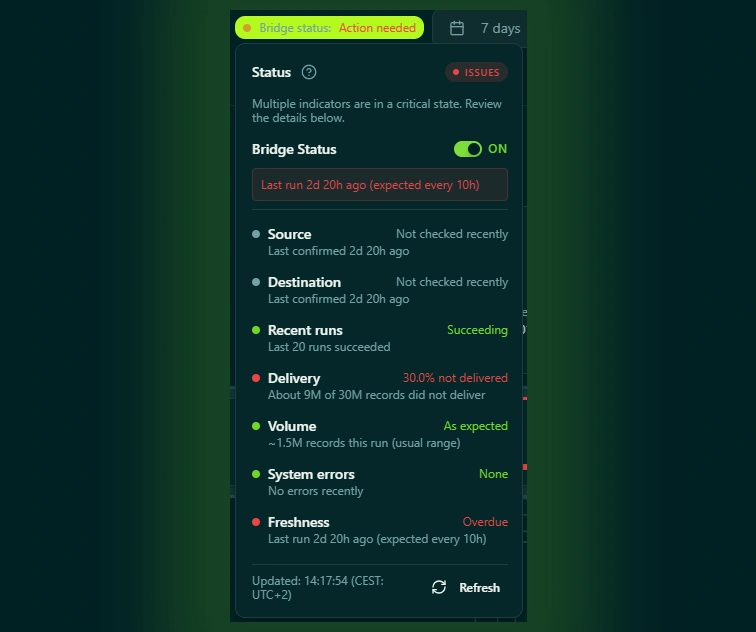
A clear record of every change
Each bridge keeps a versioned history of who changed what and when, together with a detailed record of every incident.
- Trace every change. See what was changed, who changed it, and when the change was made.
- Revert when needed. Return a bridge to an earlier version when a change needs to be undone.
- Support every report with evidence. See what ran, when it started and stopped, and how many records were affected, so every number can be traced back to its source.